
We met with Dr. Patti tonight. This time we had Gavin hang with Lizze's Mom so that we could talk to the boys.
We wanted to talk to Elliott and Emmett about Gavin and the whole residential treatment thing.
As the conversation went forward and we were trying to help Elliott to feel a little better about what will be happening, something really interesting happened. We were discussing why Gavin needed to move out and how his current behaviors were effecting everyone, especially Elliott and Emmett.
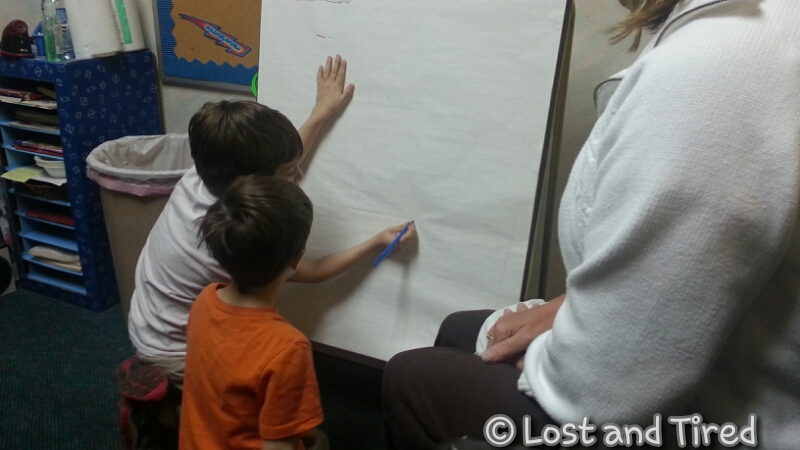
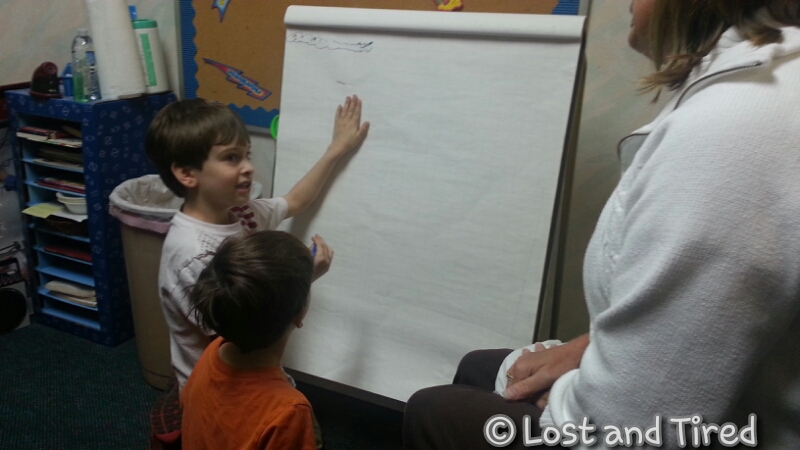
Dr. Patti asked Elliott how he felt when Gavin was throwing a tantrum. Elliott replied by saying that it really scared him. Then the craziest thing happened. Elliott asked if he could draw a picture of how he felt. We of course, said *absolutely*.
The next thing we know, Elliott is drawing a friggin *bar graph*.
It's really hard to see in the picture but basically, he created this graph to illustrate how he feels as Gavin's tantrums get louder and more violent.
We were all pretty much in shock as we watched this unfold.
I've always known that Elliott was smart but holy crap, this is just beyond anything I would have imagined.
The graph even made sense.
He showed how his level of fear increased as Gavin's tantrums got worse.
As if that wasn't enough, Emmett decided to do the same thing. He created his own friggin bar graph, modeled after Elliott but with different data points to reflect his experience with Gavin's tantrums.
Taking it one more step further, the boys actually got along tonight a day even worked together on some of these illustrations.
I have no idea where he learned to do this but I didn't think that most 6 years olds would spontaneously decide to express themselves by means of a bar graph.
I think that it actually helped them to talk about this tonight and explain to us how they felt in their own unique and impressive way. I honestly don't even know what to say because I'm still picking my jaw up off of the floor.
All I can say is, *color me impressed. *

